Average Catch
AvC.RdA simple average catch MP that is included to demonstrate a 'status quo' management option
AvC(x, Data, reps = 100, plot = FALSE)
Arguments
| x | A position in the data object |
|---|---|
| Data | A data object |
| reps | The number of stochastic samples of the MP recommendation(s) |
| plot | Logical. Show the plot? |
Value
An object of class Rec with the TAC slot populated with a numeric vector of length reps
Details
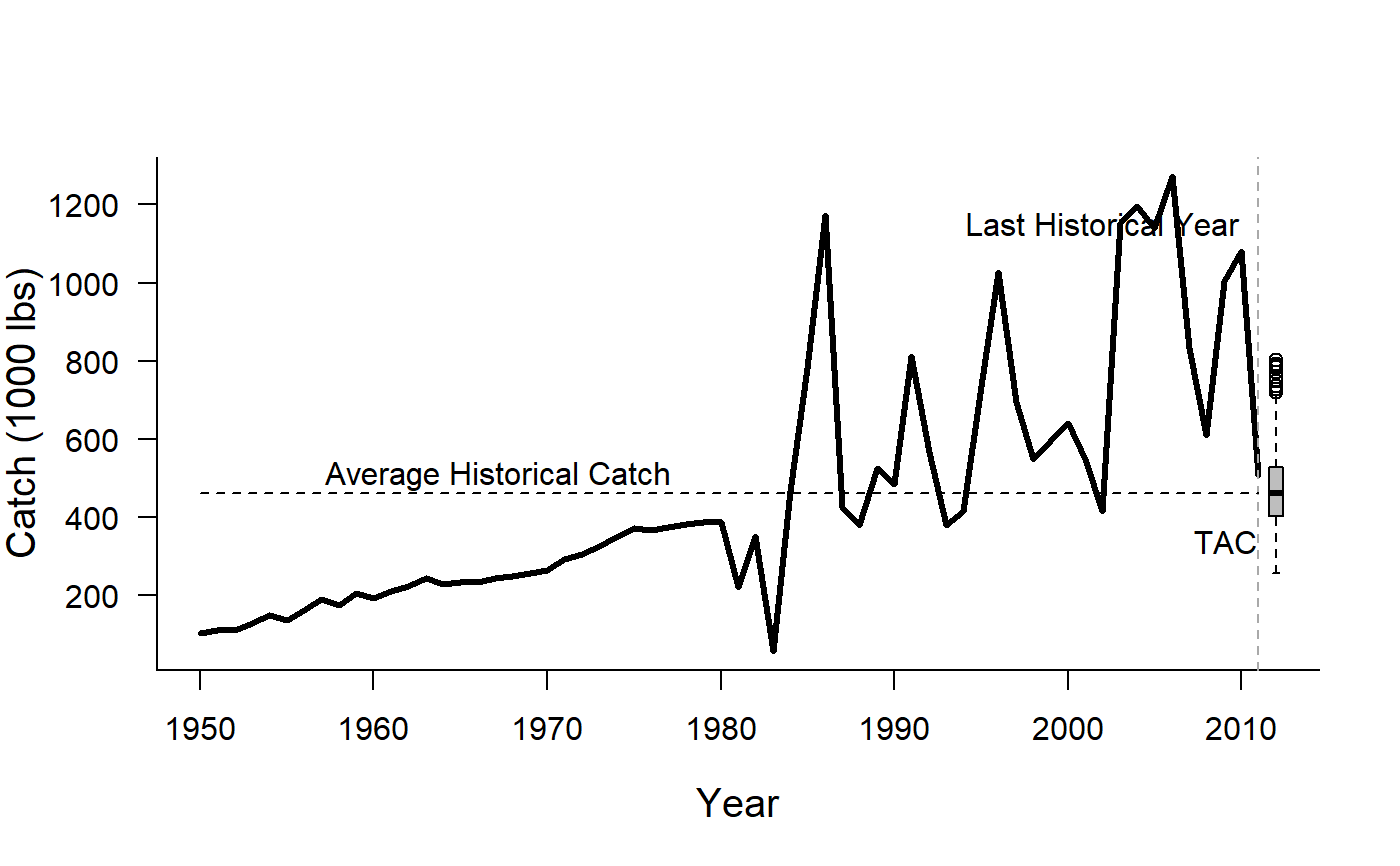
The average catch method is very simple. The mean historical catch is calculated and used to set
a constant catch limit (TAC). If reps > 1 then the reps samples are drawn from a log-normal
distribution with mean TAC and standard deviation (in log-space) of 0.2.
For completeness, the TAC is calculated by:
$$\textrm{TAC} =\frac{\sum_{y=1}^{\textrm{n}}{C_y}}{\textrm{n}}$$
where \(\textrm{TAC}\) is the the mean catch recommendation, \(n\) is the number of historical years, and \(C_y\) is the catch in historical year \(y\)
Required Data
See Data for information on the Data object
AvC: Cat, LHYear, Year
Rendered Equations
See Online Documentation for correctly rendered equations
