Age-Composition Stock-Reduction Analysis
CompSRA.RdA stock reduction analysis (SRA) model is fitted to the age-composition from the last 3 years (or less if fewer data are available)
CompSRA(x, Data, reps = 100, plot = FALSE)

CompSRA4010(x, Data, reps = 100, plot = FALSE)
Arguments
| x | A position in the data object |
|---|---|
| Data | A data object |
| reps | The number of stochastic samples of the MP recommendation(s) |
| plot | Logical. Show the plot? |
Value
An object of class Rec with the TAC slot populated with a numeric vector of length reps
Details
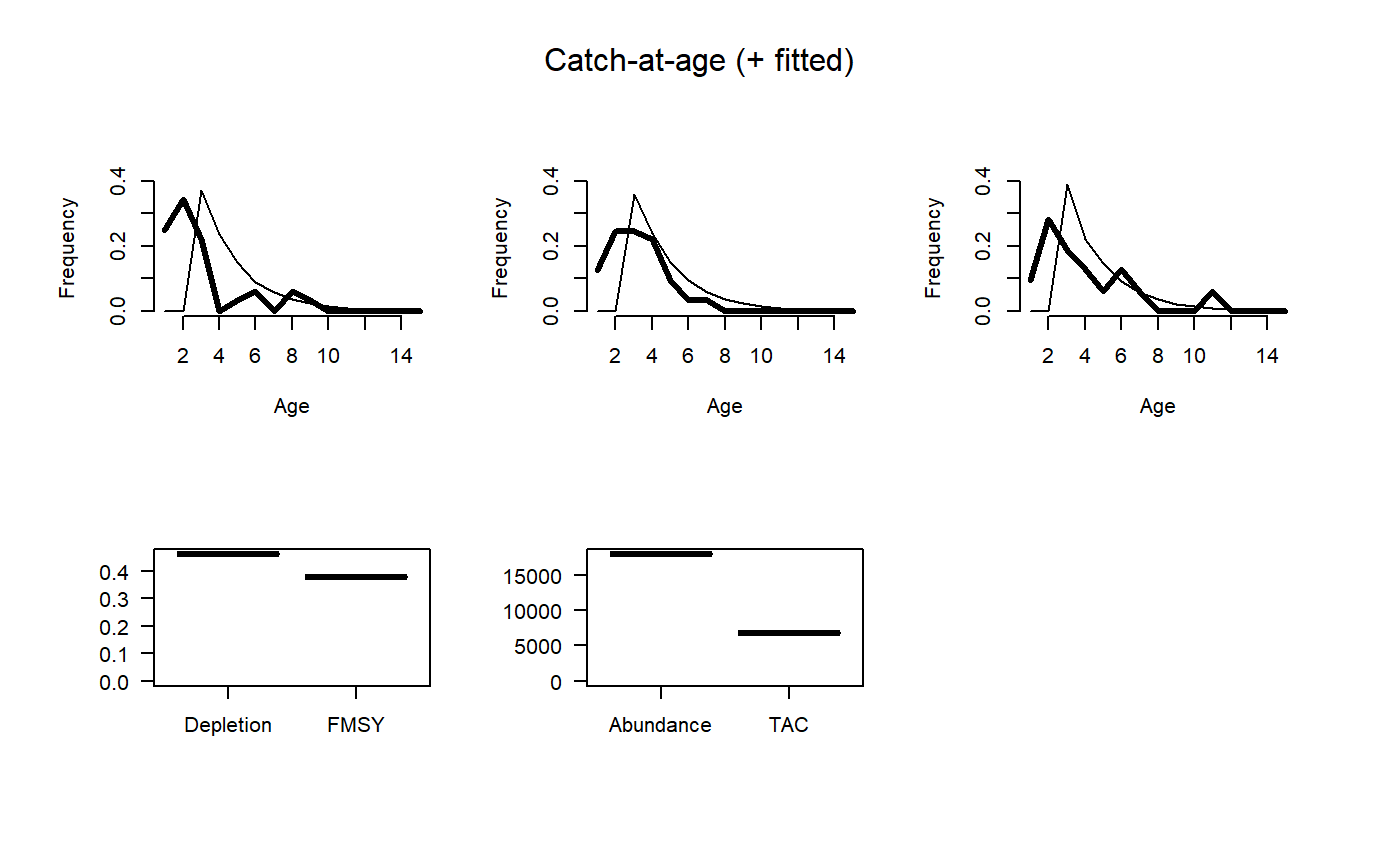
A stock reduction analysis (SRA) model is fitted to the age-composition from the last 3 years (or less if fewer data are available) assuming a constant total mortality rate (Z) and used to estimate current stock depletion (D), \(F_\textrm{MSY}\), and stock abundance (A).
Abundance is estimated in the SRA. \(F_{\textrm{MSY}}\) is calculated assuming knife-edge vulnerability at the age of full selection.
The TAC is calculated as \(F_\textrm{MSY} A\). CompSRA4010 uses a 40-10
harvest control rule to reduce TAC at low biomass.
Functions
CompSRA: TAC is FMSY x AbundanceCompSRA4010: With a 40-10 control rule based on estimated depletion
Required Data
See Data for information on the Data object
CompSRA: CAA, Cat, L50, LFC, LFS, MaxAge, Mort, steep, vbK, vbLinf, vbt0, wla, wlb
CompSRA4010: CAA, Cat, L50, LFC, LFS, MaxAge, Mort, steep, vbK, vbLinf, vbt0, wla, wlb
Rendered Equations
See Online Documentation for correctly rendered equations
Examples
if (FALSE) {
CompSRA(1, DLMtool::SimulatedData, plot=TRUE)
}

CompSRA4010(1, DLMtool::SimulatedData, plot=TRUE)#> TAC (median)
#>      6733.58