Delay - Difference Stock Assessment
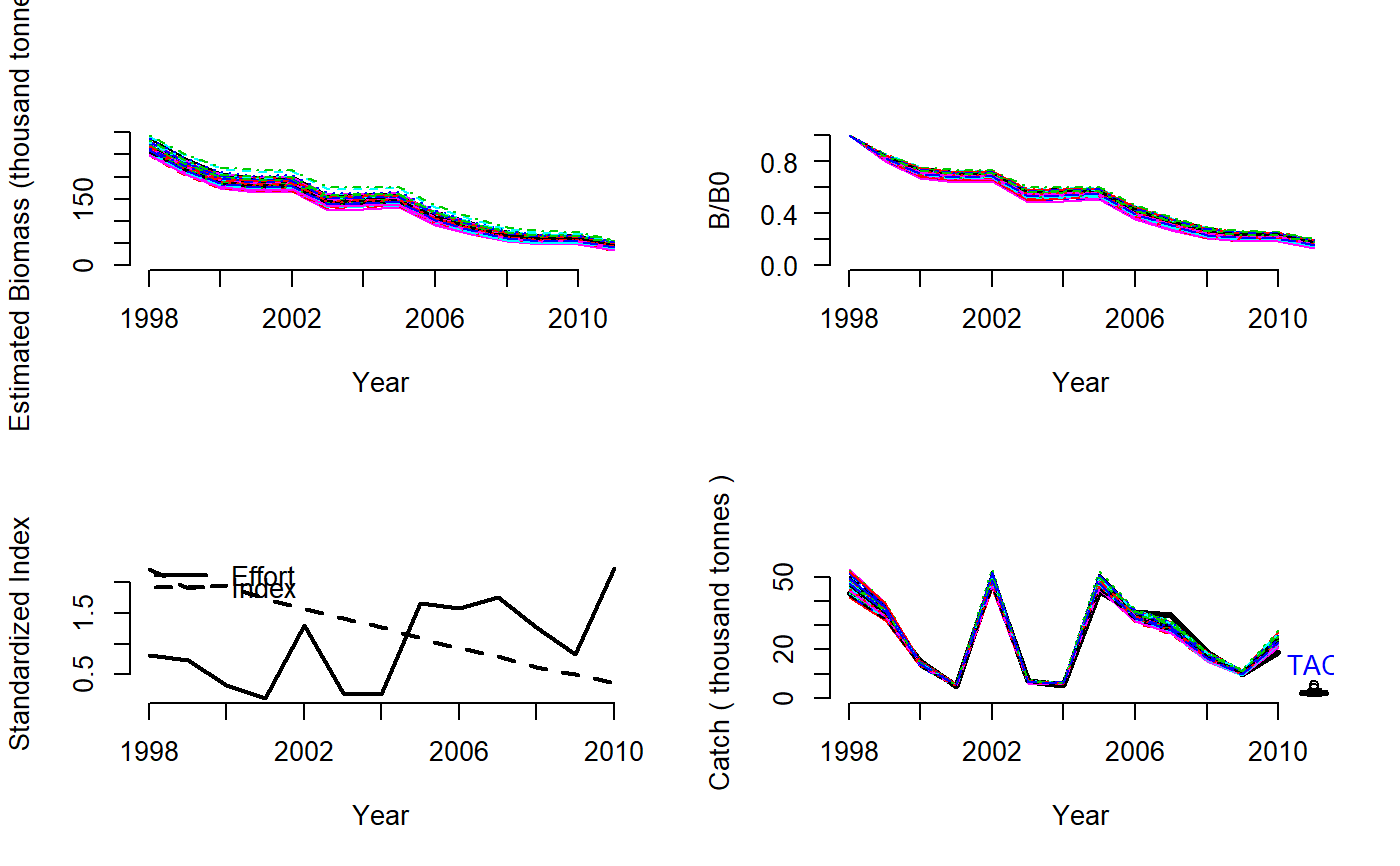
DD.RdA simple delay-difference assessment with UMSY and MSY as leading parameters that estimates the TAC using a time-series of catches and a relative
DD(x, Data, reps = 100, plot = FALSE)

DD4010(x, Data, reps = 100, plot = FALSE)
Arguments
| x | A position in the data object |
|---|---|
| Data | A data object |
| reps | The number of stochastic samples of the MP recommendation(s) |
| plot | Logical. Show the plot? |
Value
An object of class Rec with the TAC slot populated with a numeric vector of length reps
Details
This DD model is observation error only and has does not estimate process error (recruitment deviations). Assumption is that knife-edge selectivity occurs at the age of 50% maturity. Similar to many other assessment models it depends on a whole host of dubious assumptions such as temporally stationary productivity and proportionality between the abundance index and real abundance. Unsurprisingly the extent to which these assumptions are violated tends to be the biggest driver of performance for this method.
The method is conditioned on effort and estimates catch. The effort is calculated as the ratio of catch and index. Thus, to get a complete effort time series, a full time series of catch and index is also needed. Missing values are linearly interpolated.
A detailed description of the delay-difference model can be found in Chapter 9 of Hilborn and Walters (1992).
Functions
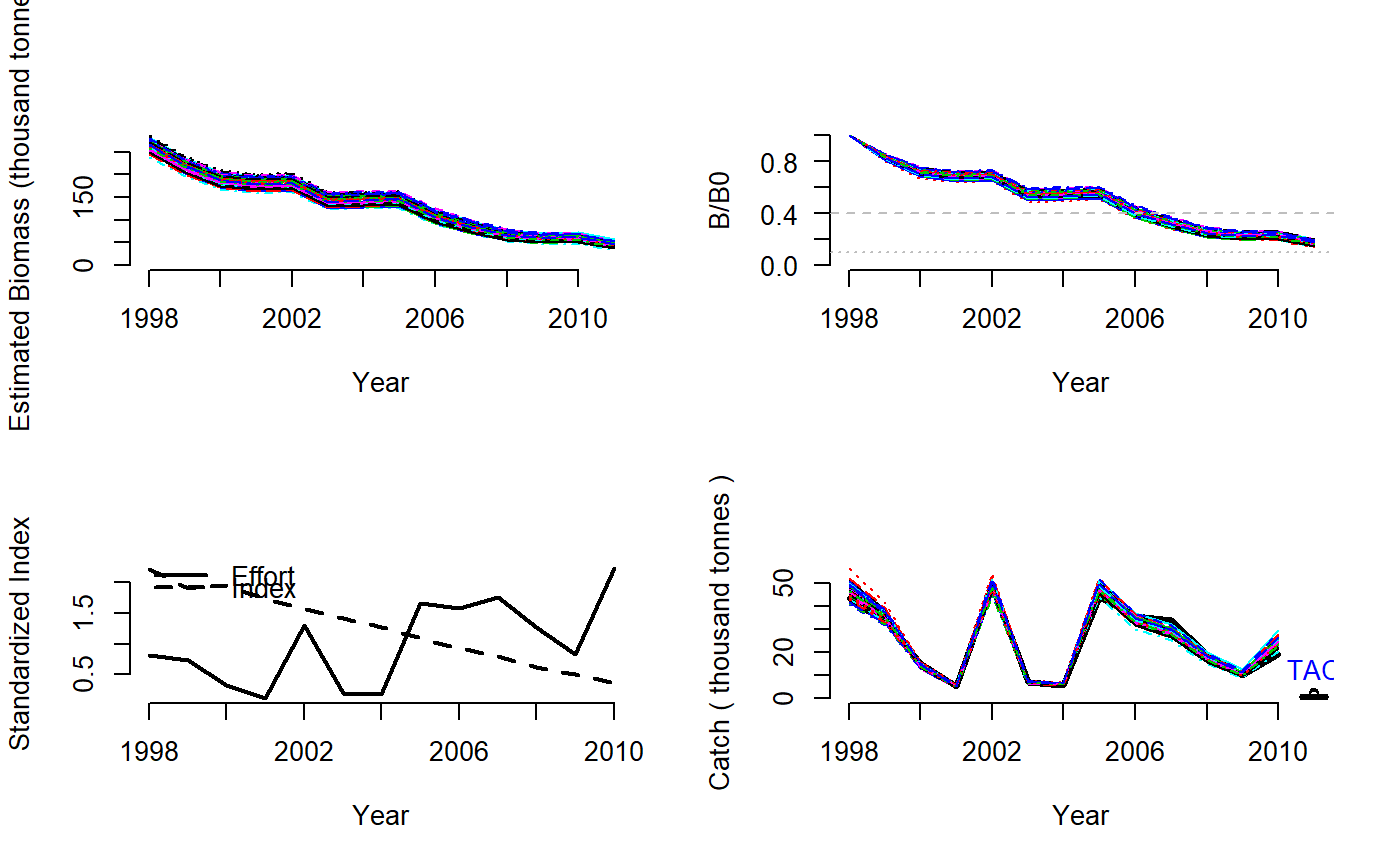
DD: Base version where the TAC = UMSY * Current Biomass.DD4010: A 40-10 rule is imposed over the TAC recommendation.
Required Data
See Data for information on the Data object
DD: Cat, Ind, L50, MaxAge, Mort, vbK, vbLinf, vbt0, wla, wlb
DD4010: Cat, Ind, L50, MaxAge, Mort, vbK, vbLinf, vbt0, wla, wlb
Rendered Equations
See Online Documentation for correctly rendered equations
References
Carruthers, T, Walters, C.J,, and McAllister, M.K. 2012. Evaluating methods that classify fisheries stock status using only fisheries catch data. Fisheries Research 119-120:66-79.
Hilborn, R., and Walters, C. 1992. Quantitative Fisheries Stock Assessment: Choice, Dynamics and Uncertainty. Chapman and Hall, New York.
See also
Other Delay-Difference MPs:
DDe()
Examples
#> TAC (median) #> 2.042656#> TAC (median) #> 0.4600147