Adaptive Fratio
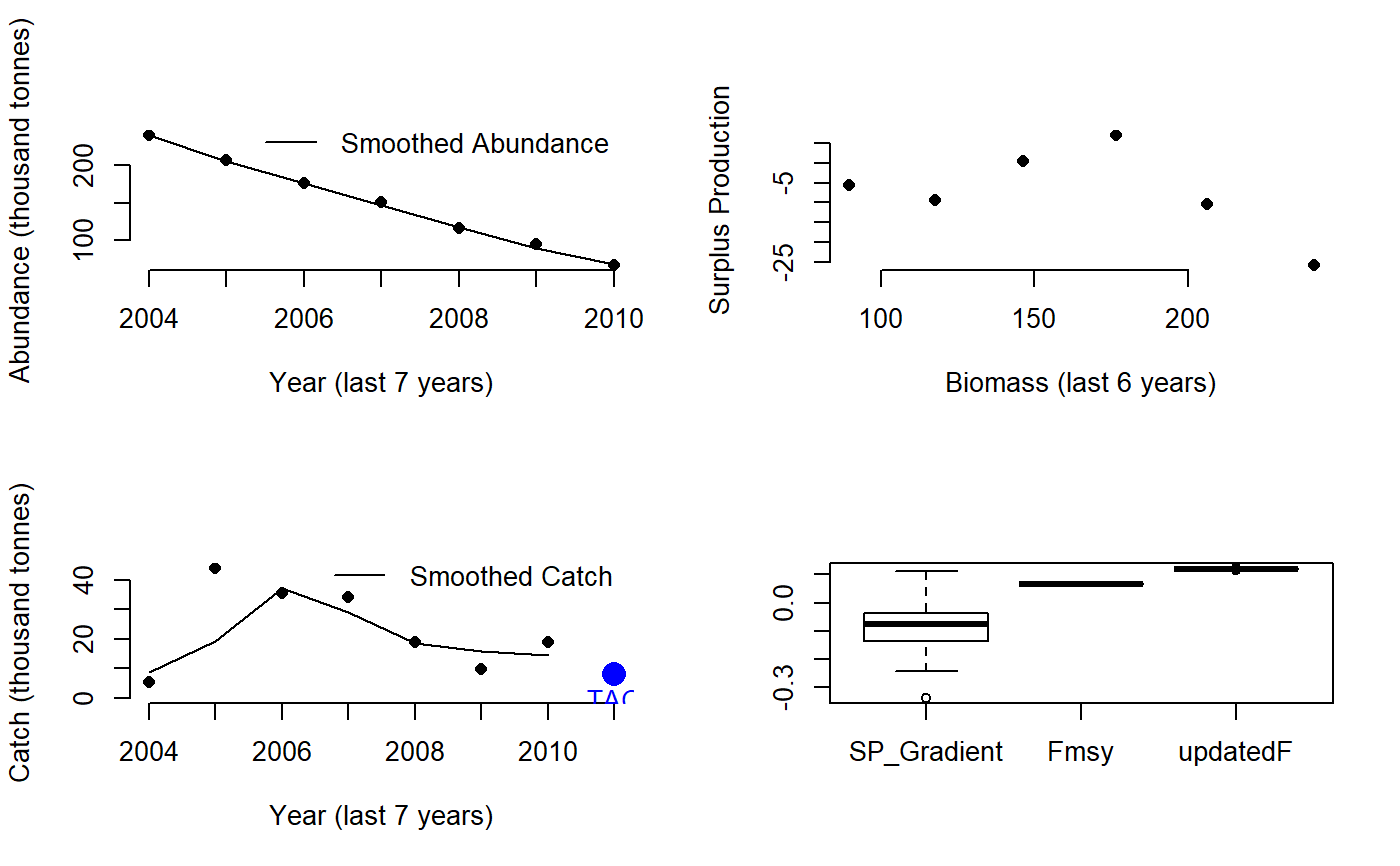
Fadapt.RdAn adaptive MP that uses trajectory in inferred suplus production and fishing mortality rate to update a TAC
Fadapt(x, Data, reps = 100, plot = FALSE, yrsmth = 7, gg = 1)
Arguments
| x | A position in the data object |
|---|---|
| Data | A data object |
| reps | The number of stochastic samples of the MP recommendation(s) |
| plot | Logical. Show the plot? |
| yrsmth | Years over which to smooth recent estimates of surplus production |
| gg | A gain parameter controlling the speed in update in TAC. |
Value
An object of class Rec with the TAC slot populated with a numeric vector of length reps
A numeric vector of quota recommendations
Details
Fishing rate is modified each year according to the gradient of surplus production with biomass (aims for zero). F is bounded by FMSY/2 and 2FMSY and walks in the logit space according to dSP/dB. This is derived from the theory of Maunder 2014.
The TAC is calculated as:
$$\textrm{TAC}_y= F_y B_{y-1}$$
where \(B_{y-1}\) is the most recent biomass, estimated with a loess smoother
of the most recent yrsmth years from the index of abundance (Data@Ind)
and estimate of current abundance (Data@Abun), and
$$F_y = F_{\textrm{lim}_1} + \left(\frac{\exp^{F_{\textrm{mod}_2}}} {1 + \exp^{F_{\textrm{mod}_2}}} F_{\textrm{lim}_3} \right) $$
where \(F_{\textrm{lim}_1} = 0.5 \frac{F_\textrm{MSY}}{M}M\),
\(F_{\textrm{lim}_2} = 2 \frac{F_\textrm{MSY}}{M}M\), \(F_{\textrm{lim}_3}\) is \(F_{\textrm{lim}_2} - F_{\textrm{lim}_1}\),
\(F_{\textrm{mod}_2}\) is
$$F_{\textrm{mod}_1} + g -G$$
where \(g\) is gain parameter gg, G is the predicted surplus production given current abundance,
and:
$$F_{\textrm{mod}_1} =
\left\{\begin{array}{ll}
-2 & \textrm{if } F_\textrm{old} < F_{\textrm{lim}_1} \\
2 & \textrm{if } F_\textrm{old} > F_{\textrm{lim}_2} \\
\log{\frac{F_\textrm{frac}}{1-F_\textrm{frac}}} & \textrm{if } F_{\textrm{lim}_1} \leq F_\textrm{old} \leq F_{\textrm{lim}_2} \\
\end{array}\right.
$$
where \(-F_{\textrm{frac}} = \frac{F_{\textrm{old}} - F_{\textrm{lim}_1}}{F_{\textrm{lim}_3}} \),
\(F_\textrm{old} = \sum{\frac{C_\textrm{hist}}{B_\textrm{hist}}}/n\)
where \(C_\textrm{hist}\) and \(B_\textrm{hist}\) are smooth catch and biomass over last yrsmth,
and \(n\) is yrsmth.
Tested in Carruthers et al. 2015.
Required Data
See Data for information on the Data object
Fadapt: Abun, Cat, FMSY_M, Ind, Mort, Year
Rendered Equations
See Online Documentation for correctly rendered equations
References
Carruthers et al. 2015. Performance evaluation of simple management procedures. ICES J. Mar Sci. 73, 464-482.
Maunder, M. 2014. http://www.iattc.org/Meetings/Meetings2014/MAYSAC/PDFs/SAC-05-10b-Management-Strategy-Evaluation.pdf
See also
Other Fmsy/M methods:
DynF(),
Fratio()
Other Surplus production MPs:
Rcontrol(),
SPMSY(),
SPSRA(),
SPmod(),
SPslope()
Examples
#> TAC (median) #> 8.117012
