Geromont and Butterworth index slope Harvest Control Rule
GB_slope.RdAn MP similar to SBT1 that modifies a time-series of catch recommendations and aims for a stable catch rates.
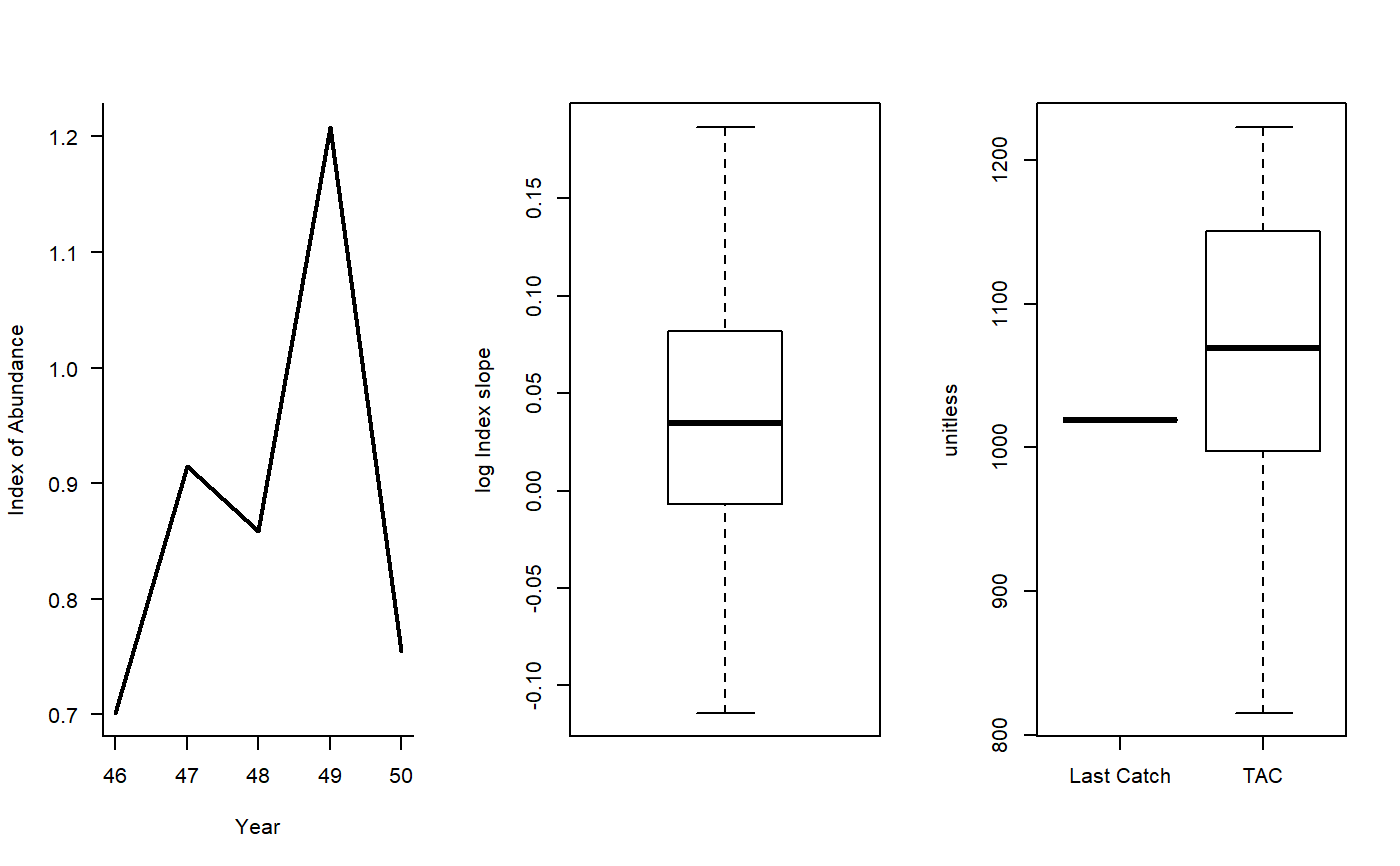
GB_slope(x, Data, reps = 100, plot = FALSE, yrsmth = 5, lambda = 1)
Arguments
| x | A position in the data object |
|---|---|
| Data | A data object |
| reps | The number of stochastic samples of the MP recommendation(s) |
| plot | Logical. Show the plot? |
| yrsmth | Number of years for evaluating slope in relative abundance index |
| lambda | A gain parameter |
Value
An object of class Rec with the TAC slot populated with a numeric vector of length reps
Details
The TAC is calculated as:
$$\textrm{TAC}_y= C_{y-1} \left(1+\lambda I\right)$$
where \(C_{y-1}\) is catch from the previous year, \(\lambda\) is a gain parameter, and \(I\) is
the slope of the linear regression of log Index (Data@Ind) over the last
yrsmth years.
The TAC is subject to the following conditions:
if next TAC > 1.2 last catch, then TAC = 1.2 last catch
if next TAC < 0.8 last catch, then TAC = 0.8 last catch
Note that this is my interpretation of their approach and is now stochastic. Currently it is generalized and is not 'tuned' to more detailed assessment data which might explain why in some cases it leads to stock declines.
Required Data
See Data for information on the Data object
GB_slope: Cat, Ind, Year
Rendered Equations
See Online Documentation for correctly rendered equations
References
Geromont, H.F. and Butterworth, D.S. 2014. Complex assessment or simple management procedures for efficient fisheries management: a comparative study. ICES J. Mar. Sci. doi:10.1093/icesjms/fsu017
See also
Other Index methods:
GB_target(),
Gcontrol(),
ICI(),
Iratio(),
Islope1(),
Itarget1_MPA(),
Itarget1(),
ItargetE1()
Examples
#> TAC (median) #> 1069.463