Incremental Index Target MP
Itarget1.RdA management procedure that incrementally adjusts the TAC (starting from reference level that is a fraction of mean recent catches) to reach a target CPUE / relative abundance index
Four index/CPUE target MPs proposed by Geromont and Butterworth 2014. Tested by Carruthers et al. 2015.
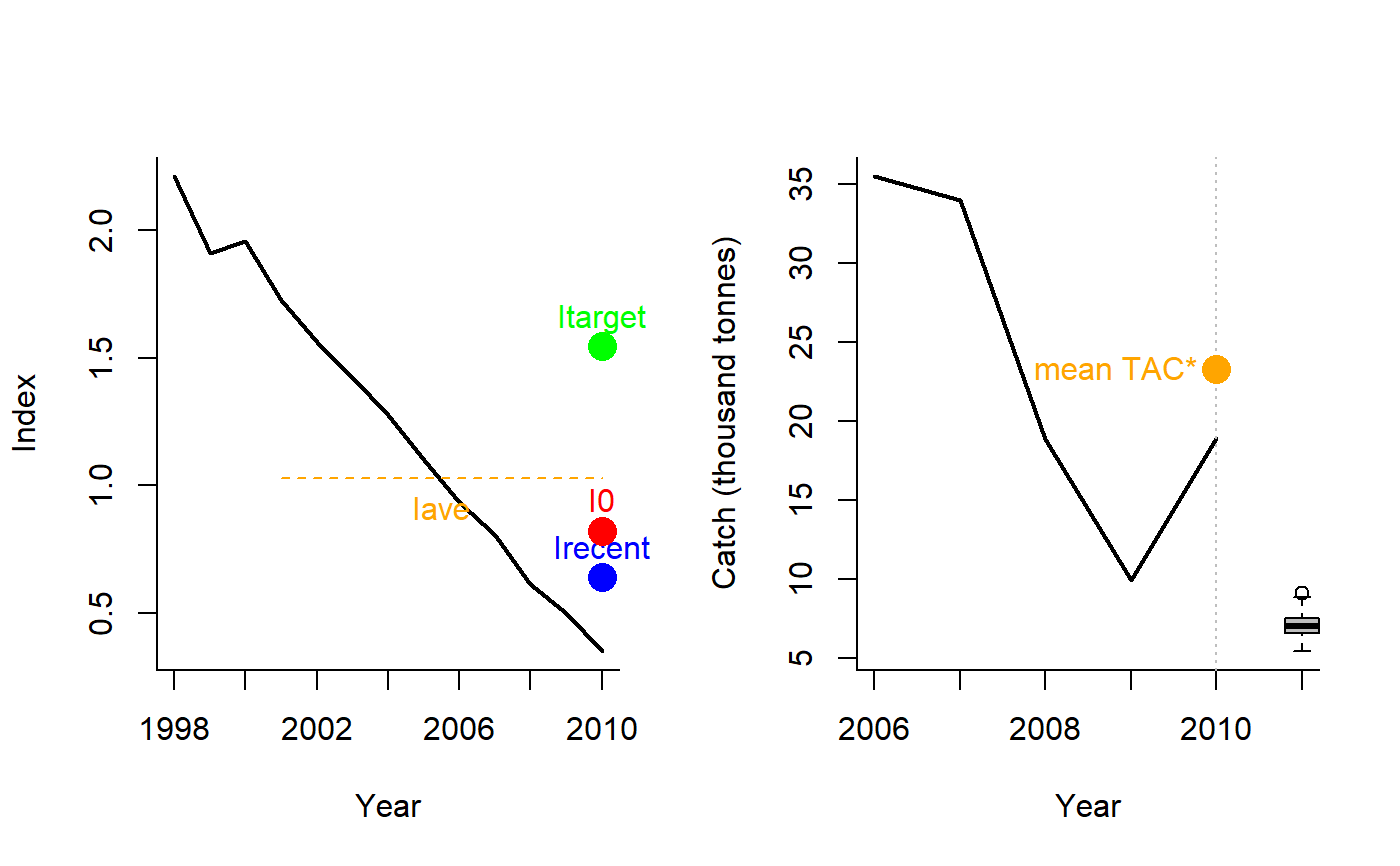
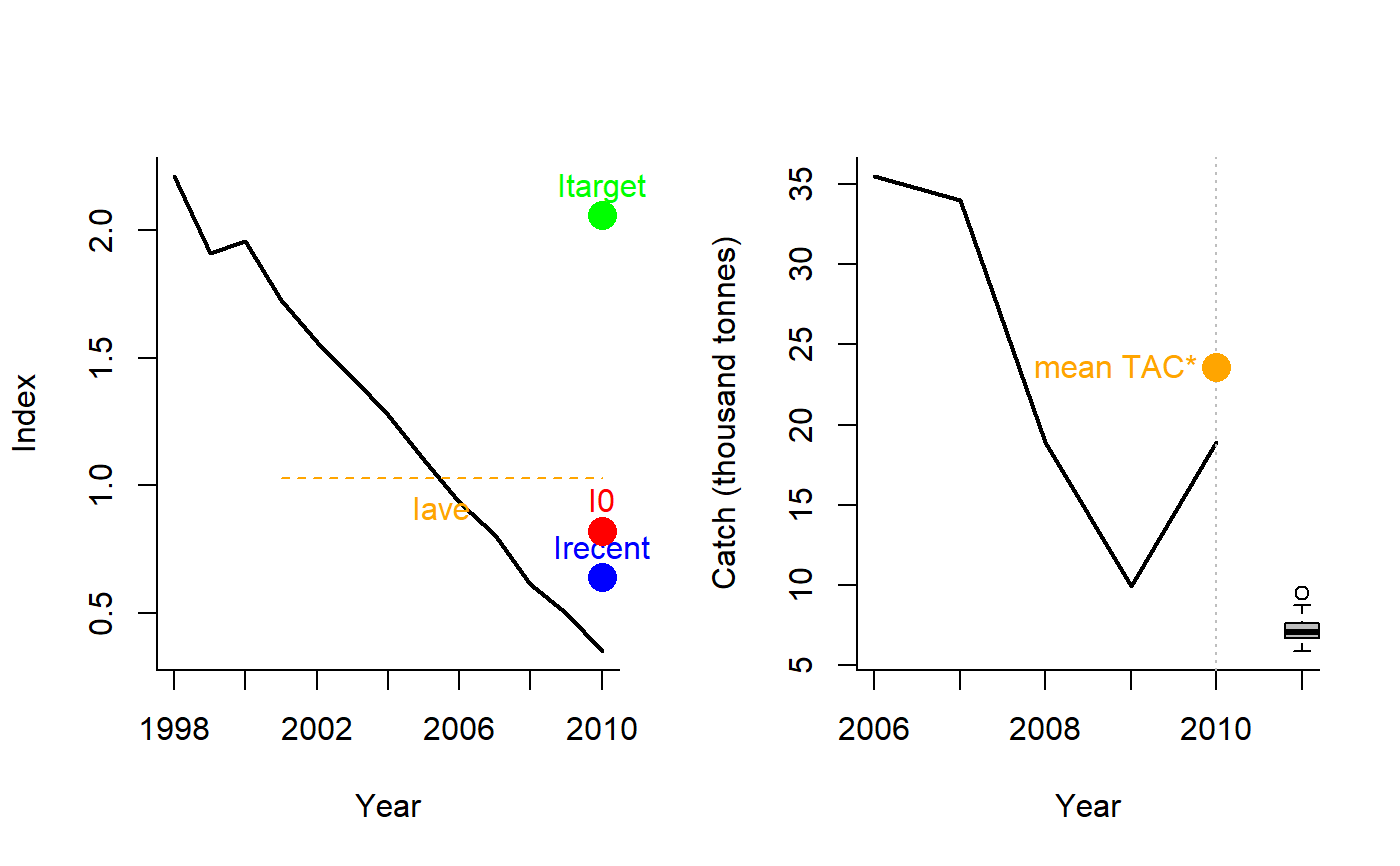
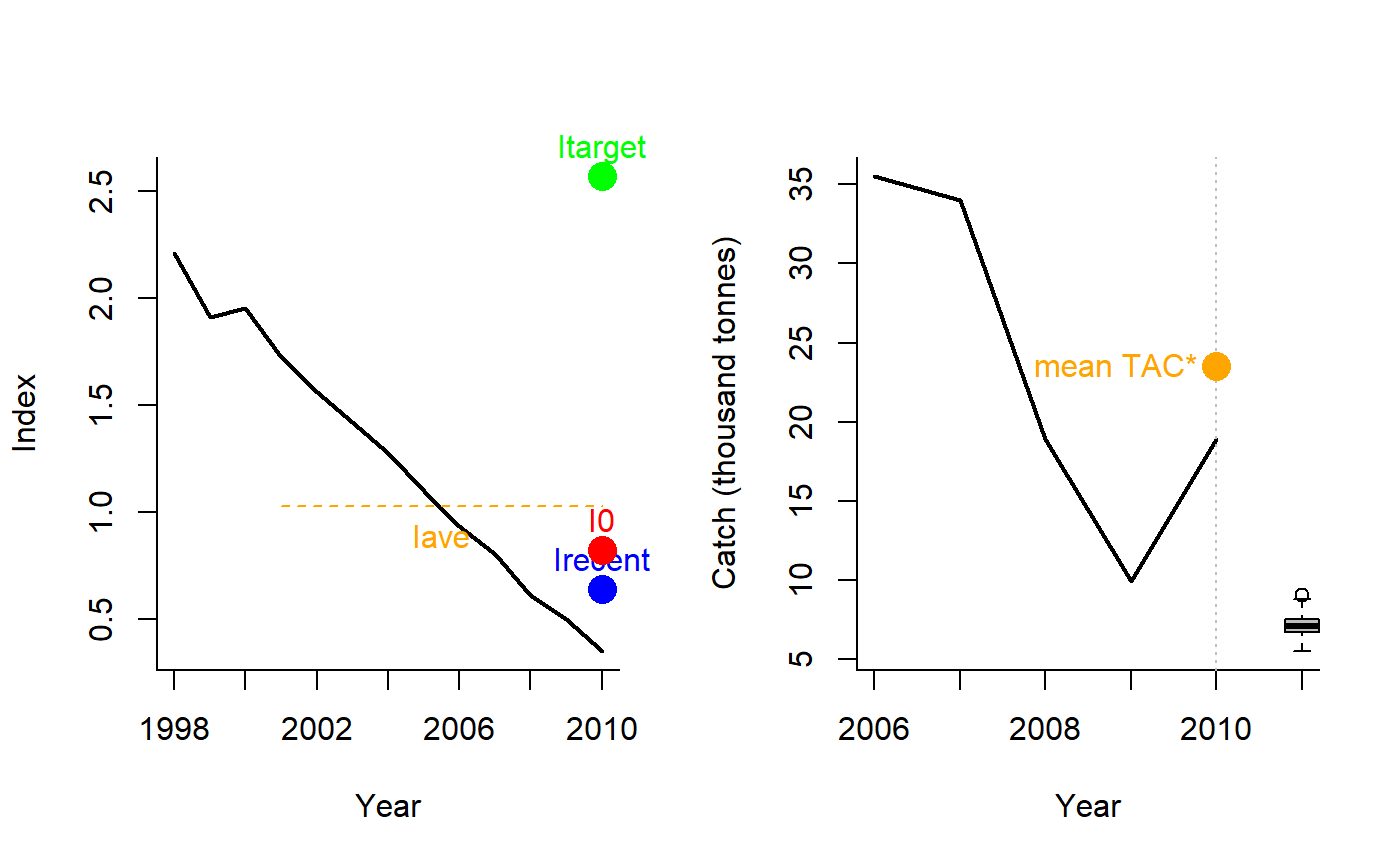
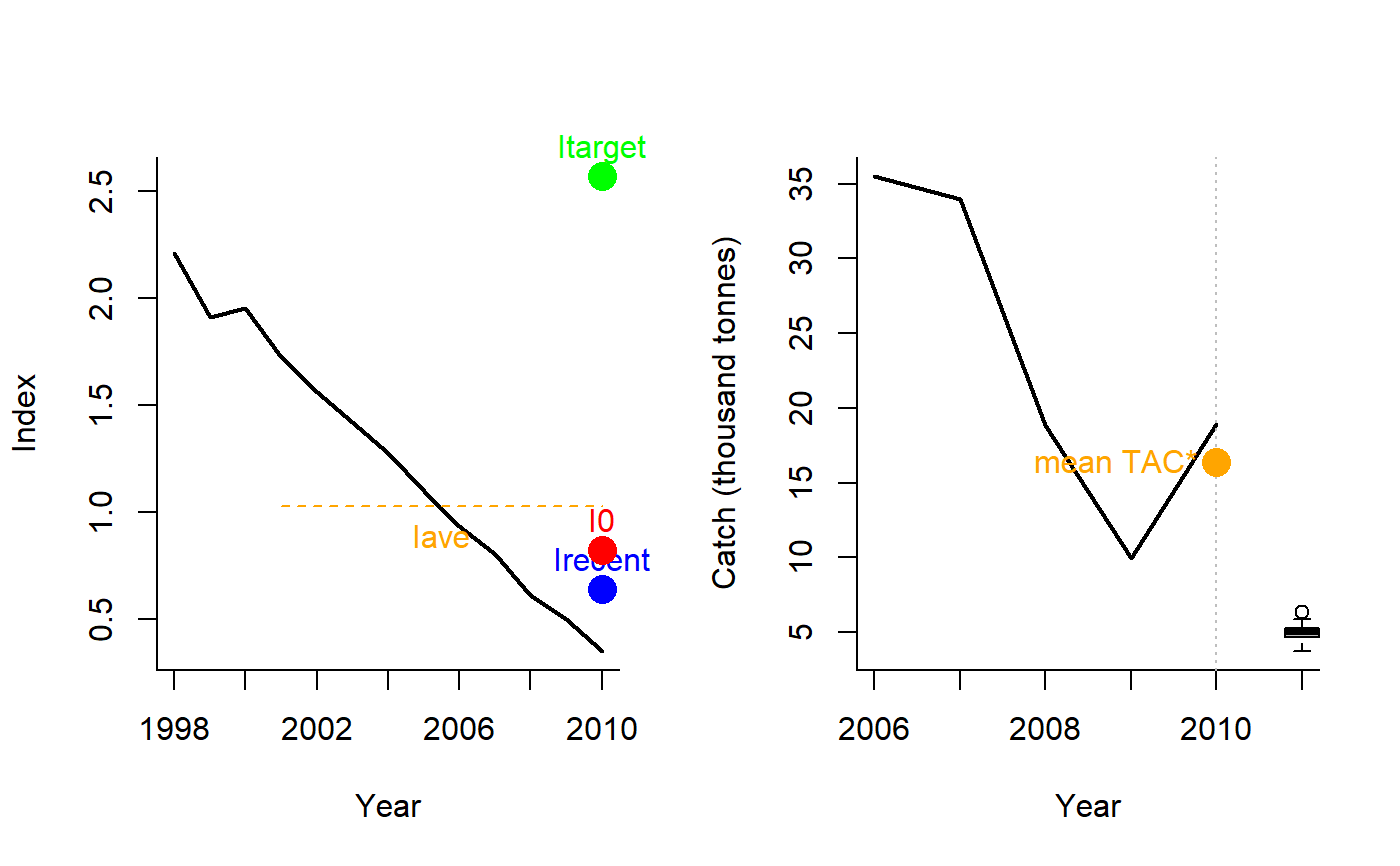
Itarget1(x, Data, reps = 100, plot = FALSE, yrsmth = 5, xx = 0, Imulti = 1.5)

Itarget2(x, Data, reps = 100, plot = FALSE, yrsmth = 5, xx = 0, Imulti = 2)

Itarget3(x, Data, reps = 100, plot = FALSE, yrsmth = 5, xx = 0, Imulti = 2.5)

Itarget4(x, Data, reps = 100, plot = FALSE, yrsmth = 5, xx = 0.3, Imulti = 2.5)
Arguments
| x | A position in the data object |
|---|---|
| Data | A data object |
| reps | The number of stochastic samples of the MP recommendation(s) |
| plot | Logical. Show the plot? |
| yrsmth | Years over which the average index is calculated. |
| xx | Parameter controlling the fraction of mean catch to start using in first year |
| Imulti | Parameter controlling how much larger target CPUE / index is compared with recent levels. |
Value
An object of class Rec with the TAC slot populated with a numeric vector of length reps
Details
The TAC is calculated as: If \(I_\textrm{recent} \geq I_0\): $$\textrm{TAC}= 0.5 \textrm{TAC}^* \left[1+\left(\frac{I_\textrm{recent} - I_0}{I_\textrm{target} - I_0}\right)\right]$$
else: $$\textrm{TAC}= 0.5 \textrm{TAC}^* \left[\frac{I_\textrm{recent}}{I_0}^2\right]$$
where \(I_0\) is \(0.8 I_{\textrm{ave}}\) (the average index over the 2 x yrsmth years prior to the projection period),
\(I_\textrm{recent}\) is the average index over the past yrsmth years, and
\(I_\textrm{target}\) is Imulti times \(I_{\textrm{ave}}\),
and \(\textrm{TAC}^*\) is:
$$(1-x)C$$
where \(x\) is argument xx and C is the average catch over the last 5 years of the historical period.
Functions
Itarget1: The less precautionary TAC-based MPItarget2: Increasing biologically precautionary TAC-based MPItarget3: Increasing biologically precautionary TAC-based MPItarget4: The most biologically precautionary TAC-based MP
Required Data
See Data for information on the Data object
Itarget1: Cat, Ind, LHYear, Year
Rendered Equations
See Online Documentation for correctly rendered equations
References
Carruthers et al. 2015. Performance evaluation of simple management procedures. ICES J. Mar Sci. 73, 464-482.
Geromont, H.F., Butterworth, D.S. 2014. Generic management procedures for data-poor fisheries; forecasting with few data. ICES J. Mar. Sci. 72, 251-261. doi:10.1093/icesjms/fst232
See also
Other Index methods:
GB_slope(),
GB_target(),
Gcontrol(),
ICI(),
Iratio(),
Islope1(),
Itarget1_MPA(),
ItargetE1()
Examples
#> TAC (median) #> 6.970583#> TAC (median) #> 7.07242#> TAC (median) #> 7.055202#> TAC (median) #> 4.978327