Chapter 24 Evaluating OM
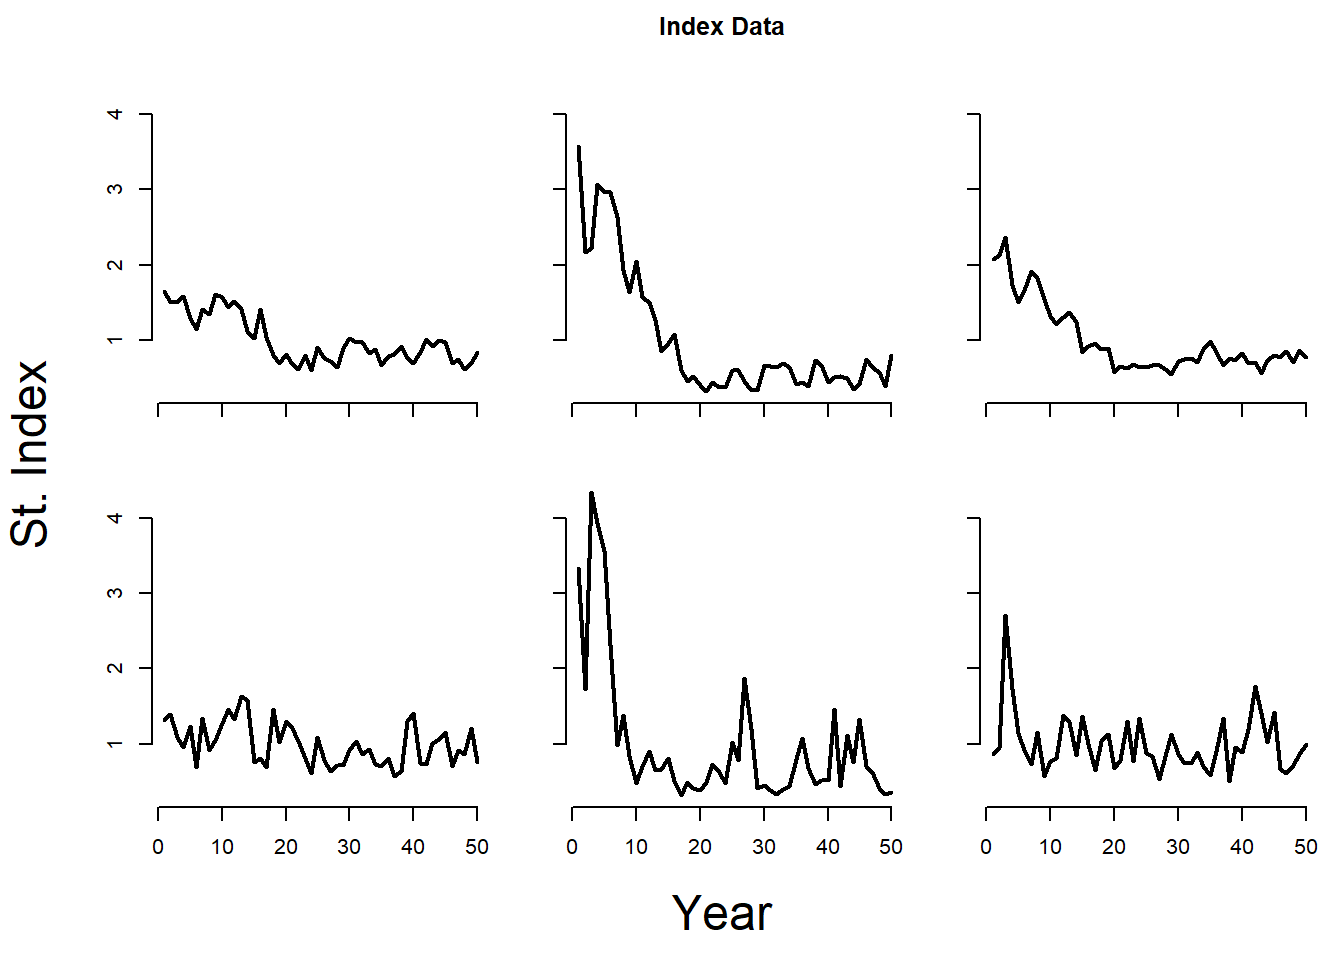
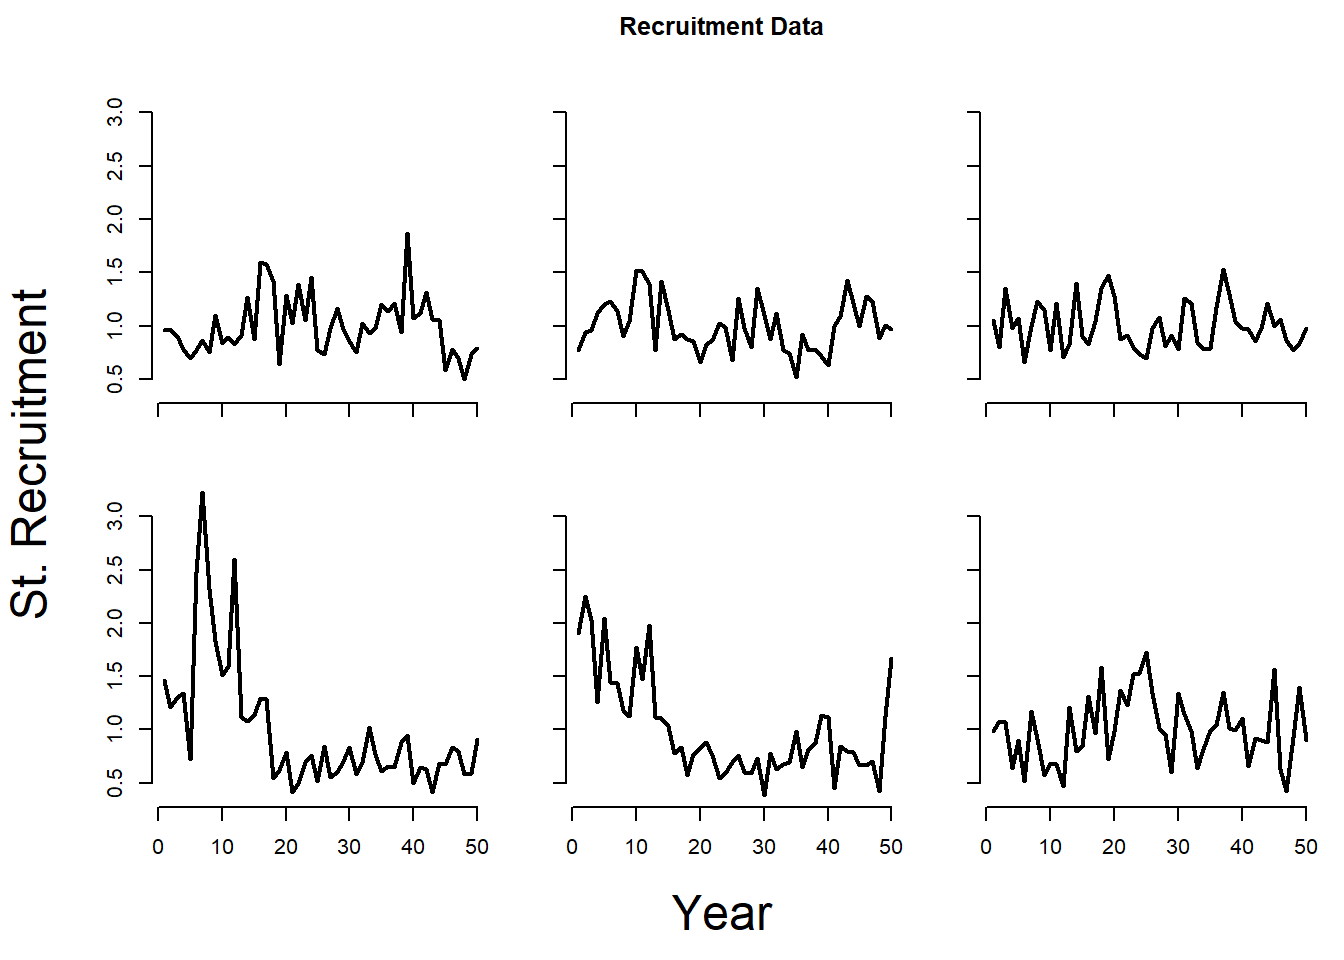
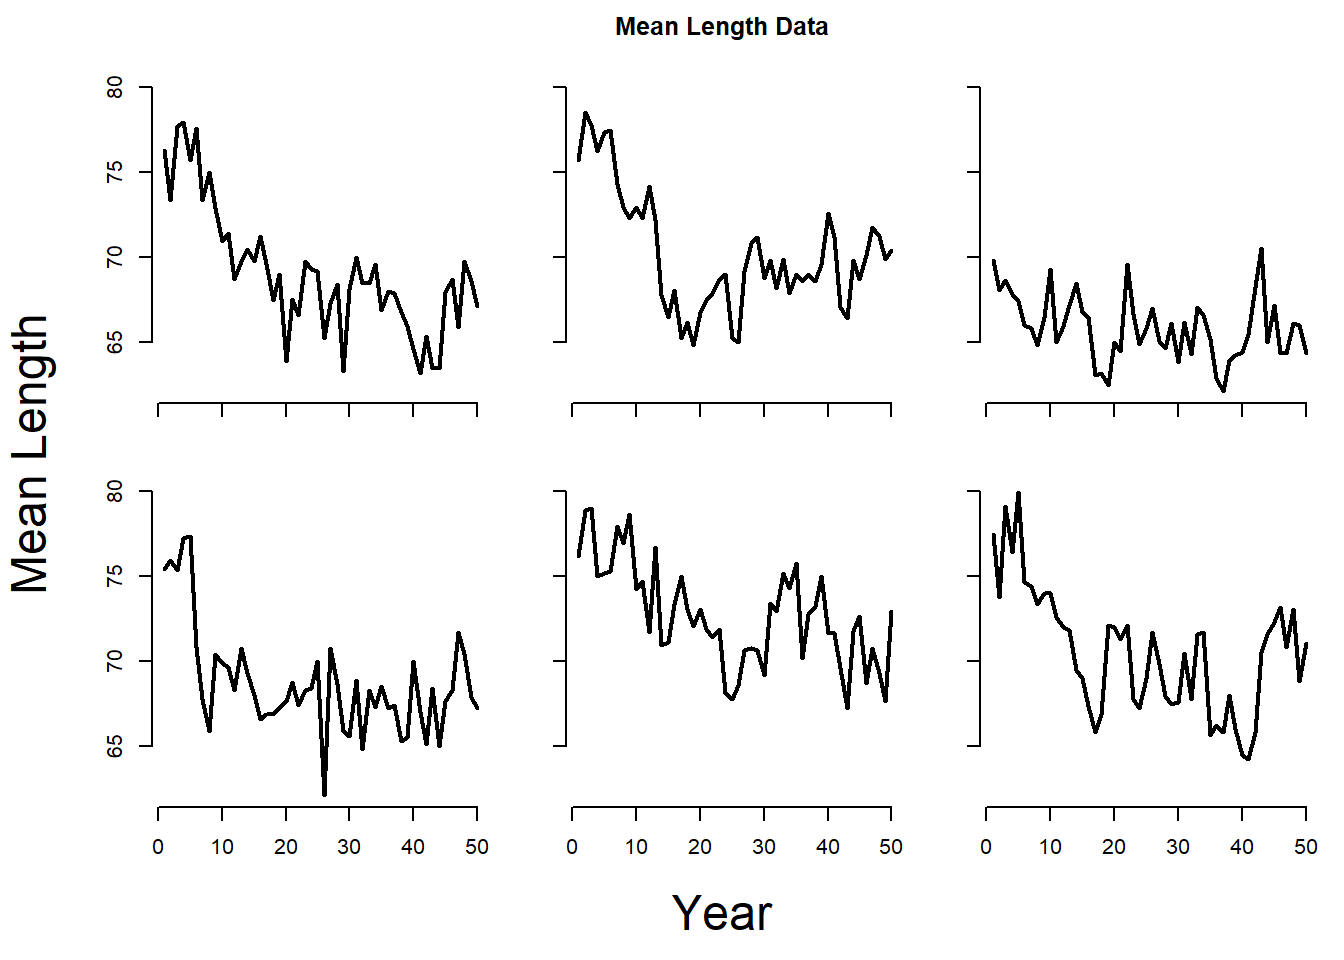
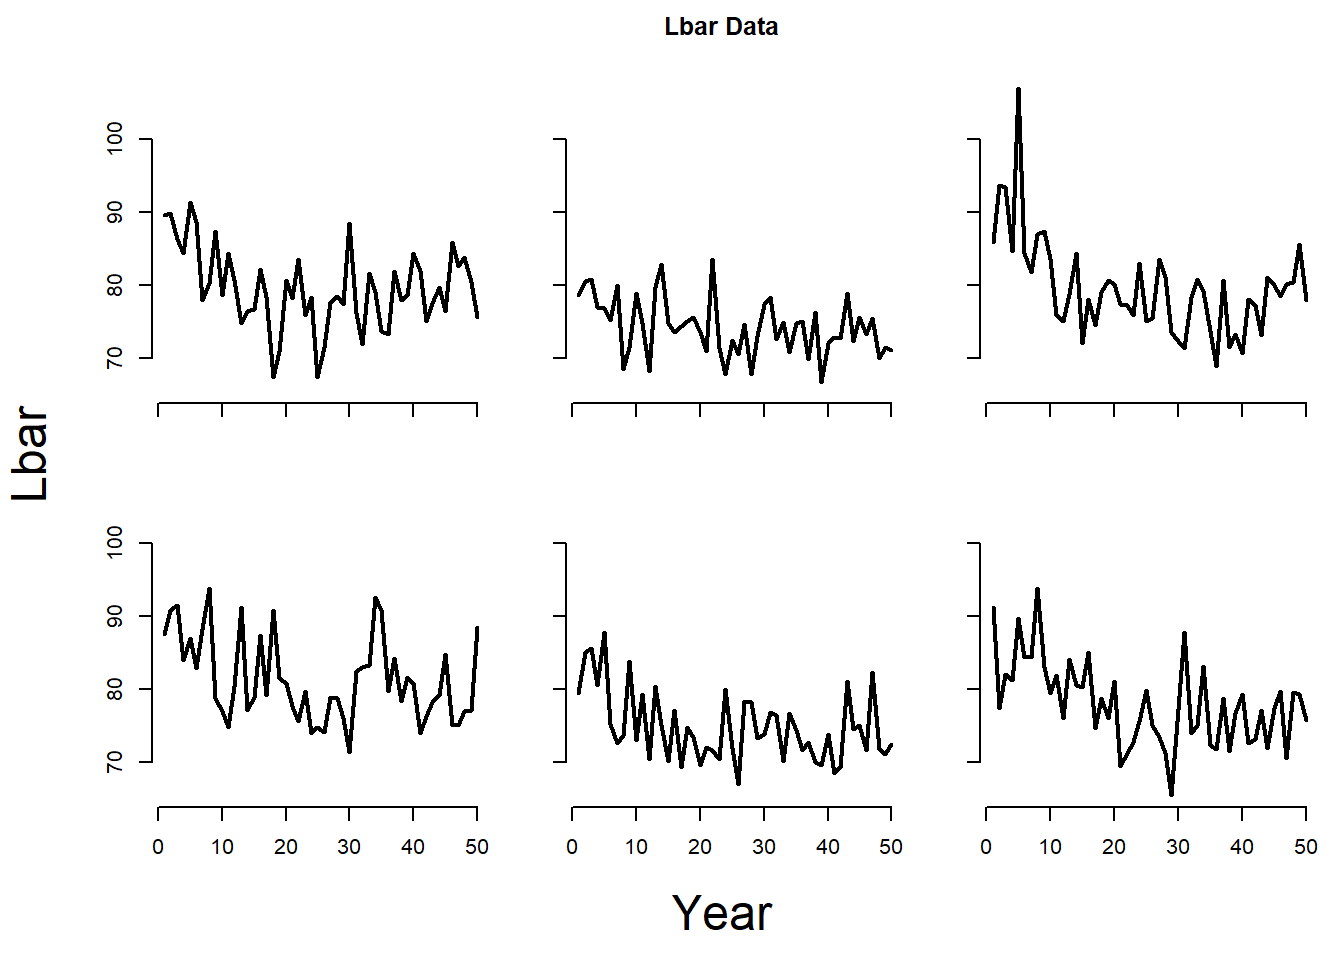
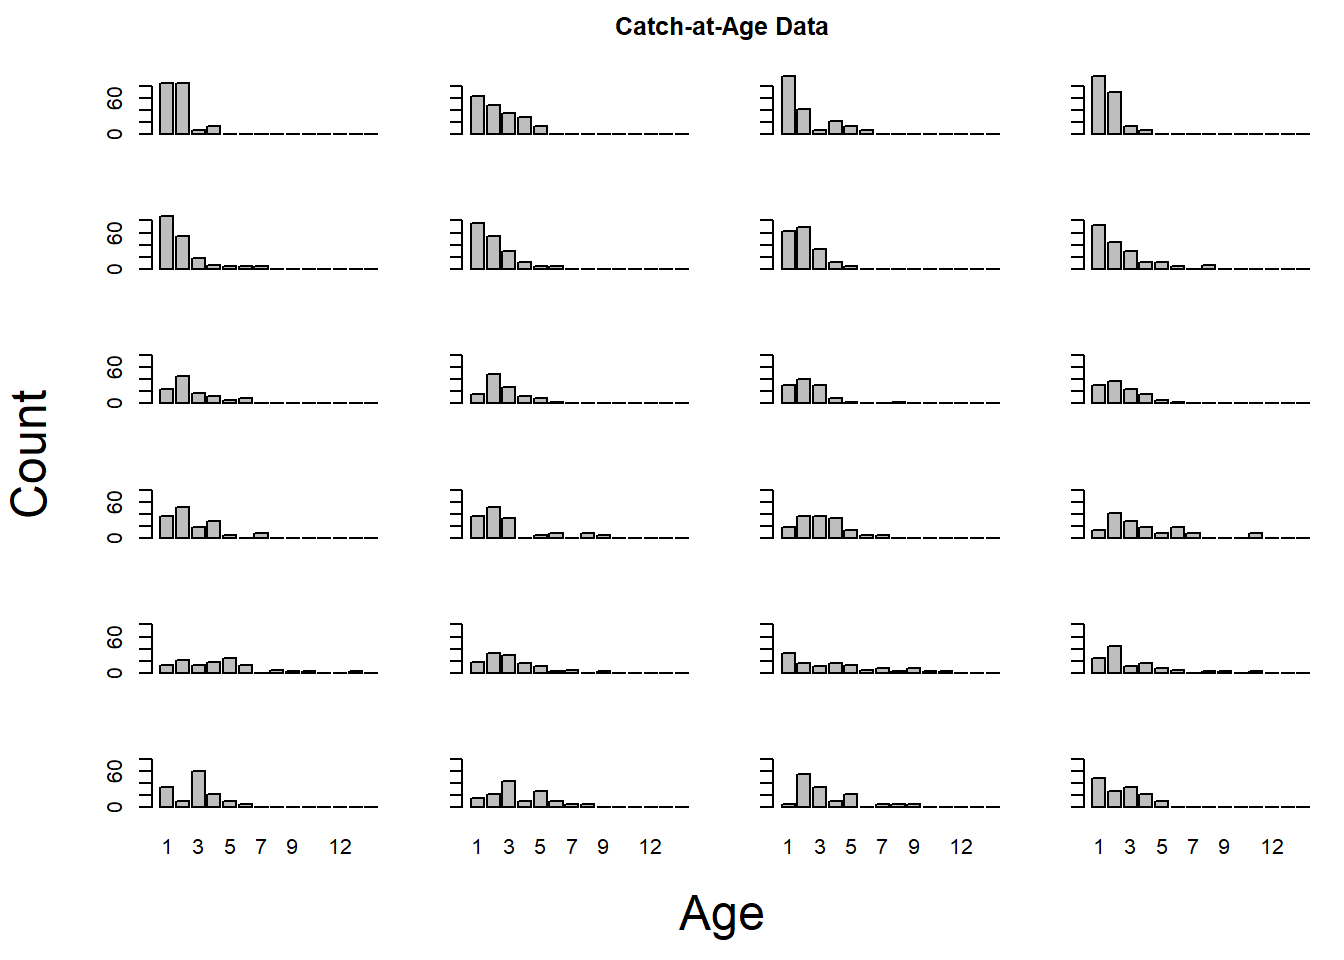
The Turing function has been designed to evaluate an Operating Model against a Data object from the same fishery. The function generates 5 random samples of Data from the OM object and plots these together with the corresponding data in the Data object.
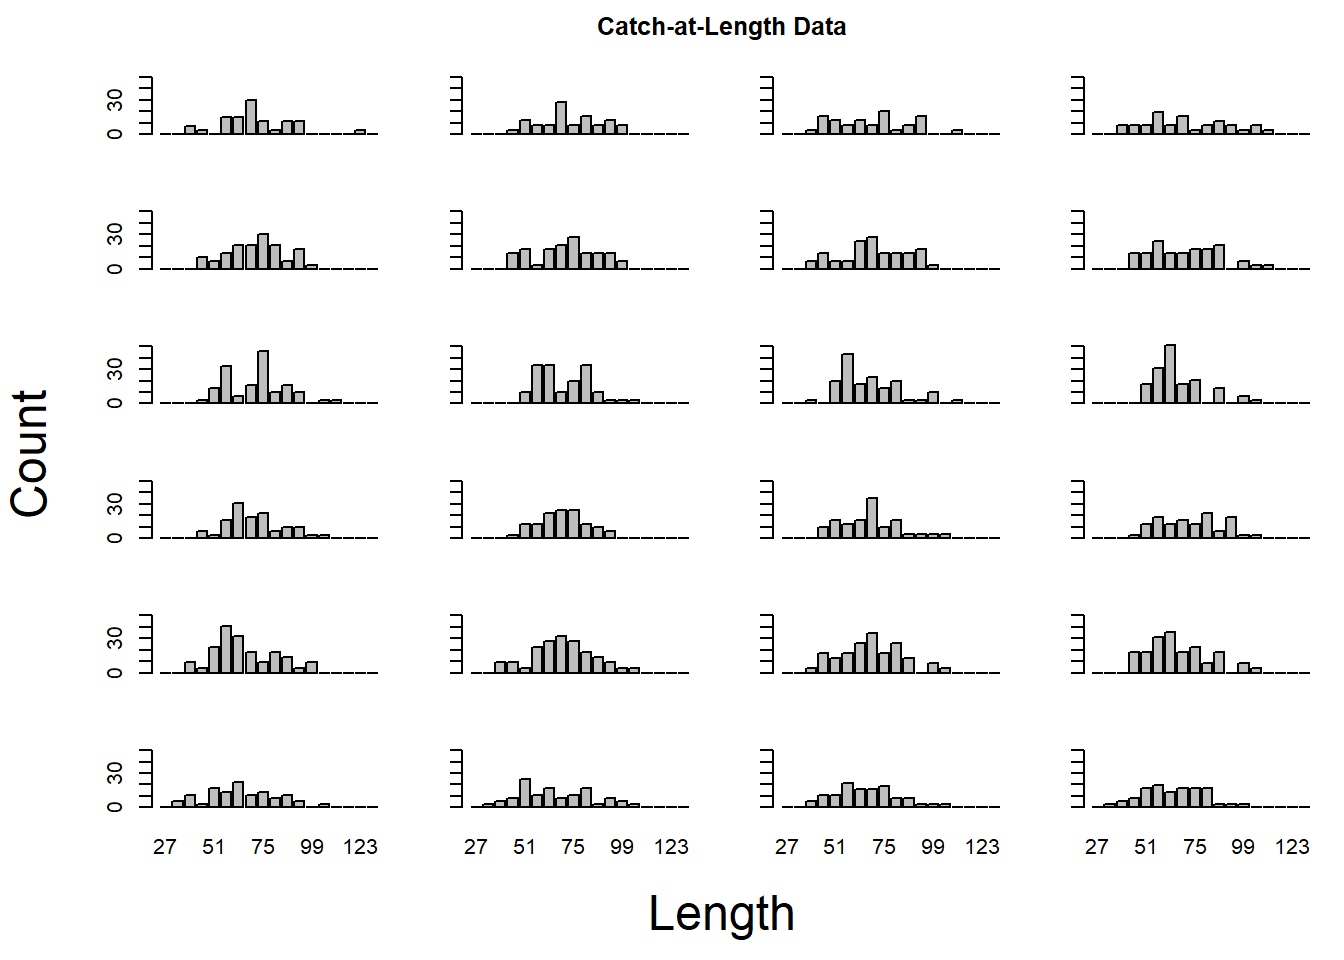
Ideally, in a well conditioned OM one should not be able to visually detect which of the plots are the real data and which have been artifically generated by the operating model.
The Turing function takes an object of class OM and an object of class Data. It first plots the simulated and real data and then waits for user input before revelaing which of the plots are the real data from the Data object.
We use the wait=FALSE argument here so that each plot is printed without waiting for user input.
In this example we are using a Data object that was simulated using the same OM, so it shouldn’t be suprising that it is difficult to detect which of the plots are from the Data object:
## Simulating Data## Randomly sampling 5 iterations## Plotting: Catch Data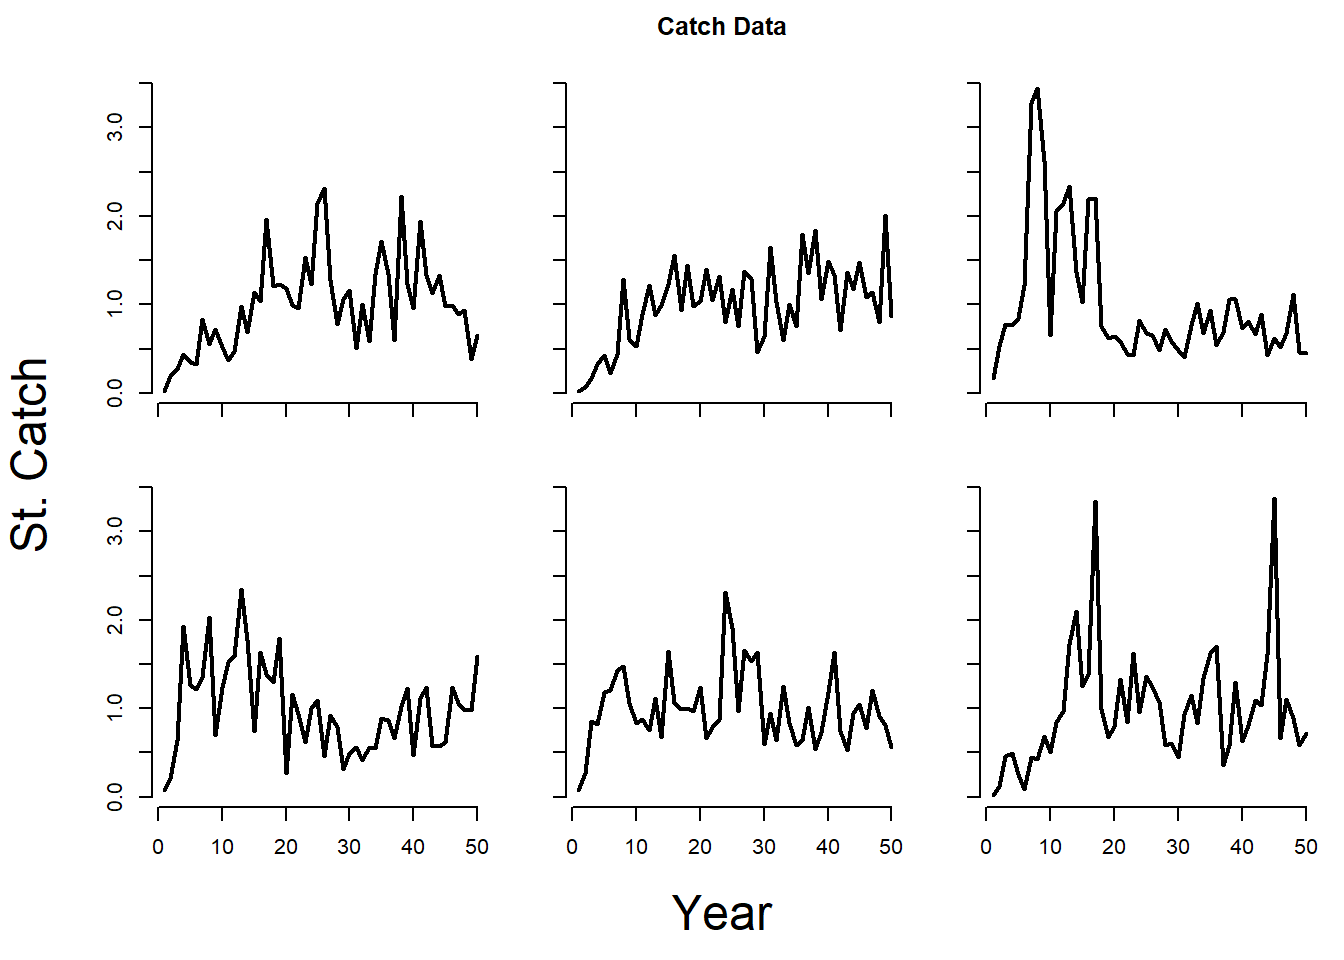
## Plotting: Index Data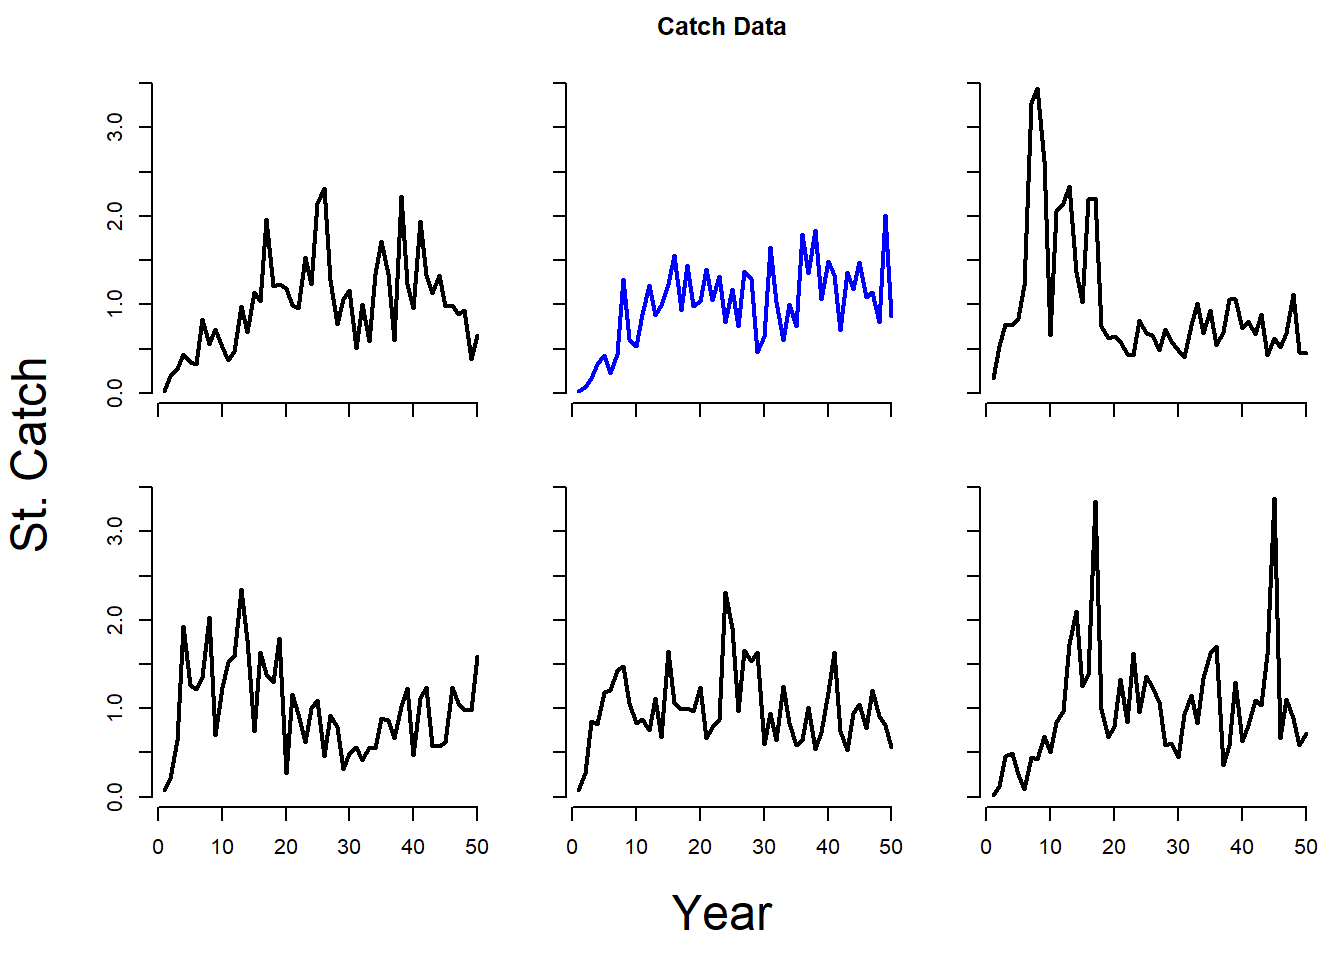
## Plotting: Recruitment Data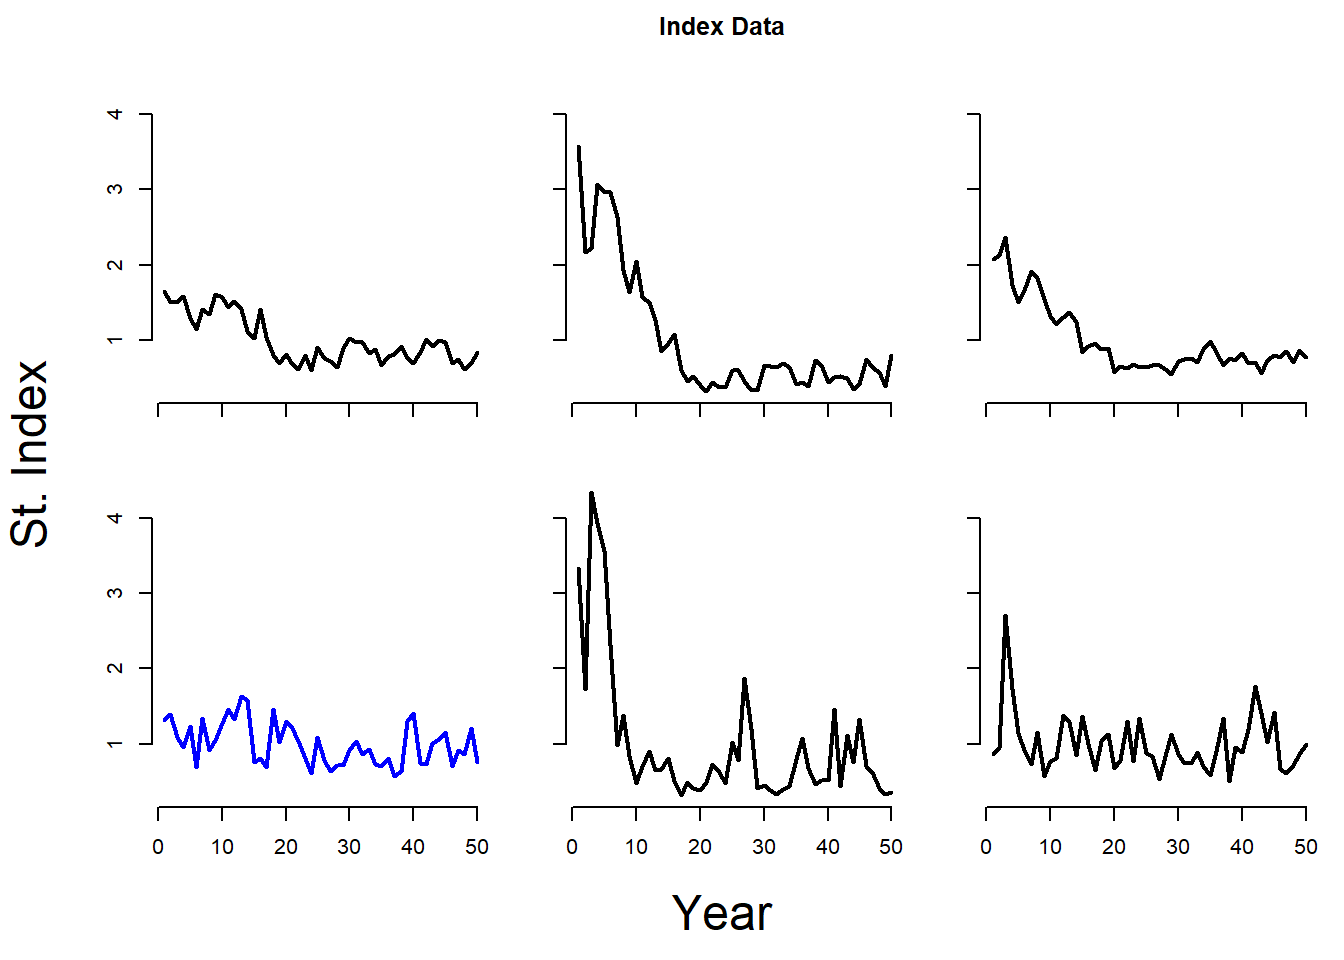
## Plotting: Mean Length Data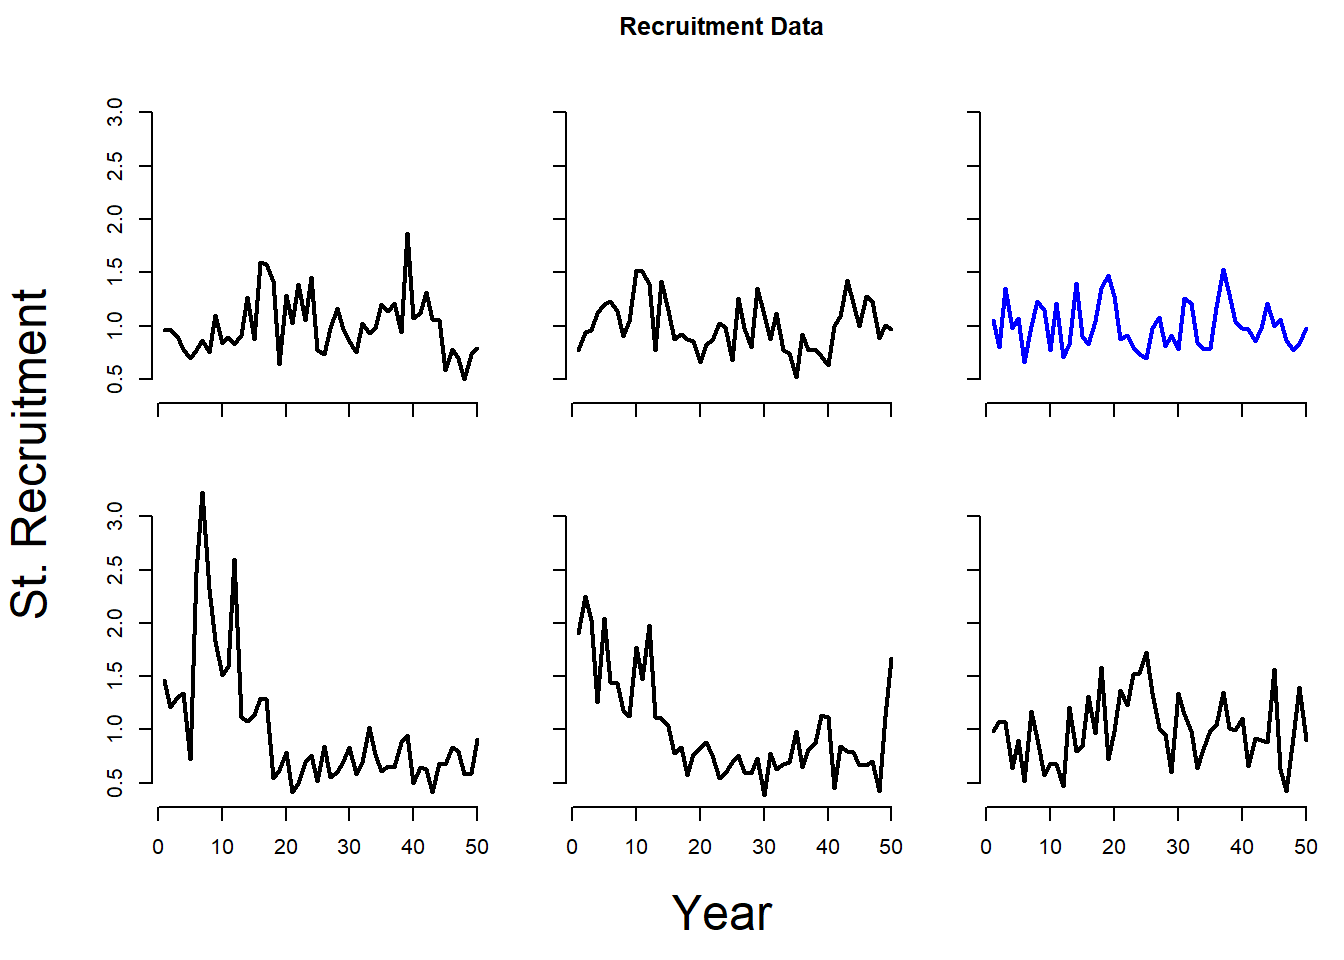
## Plotting: Lbar Data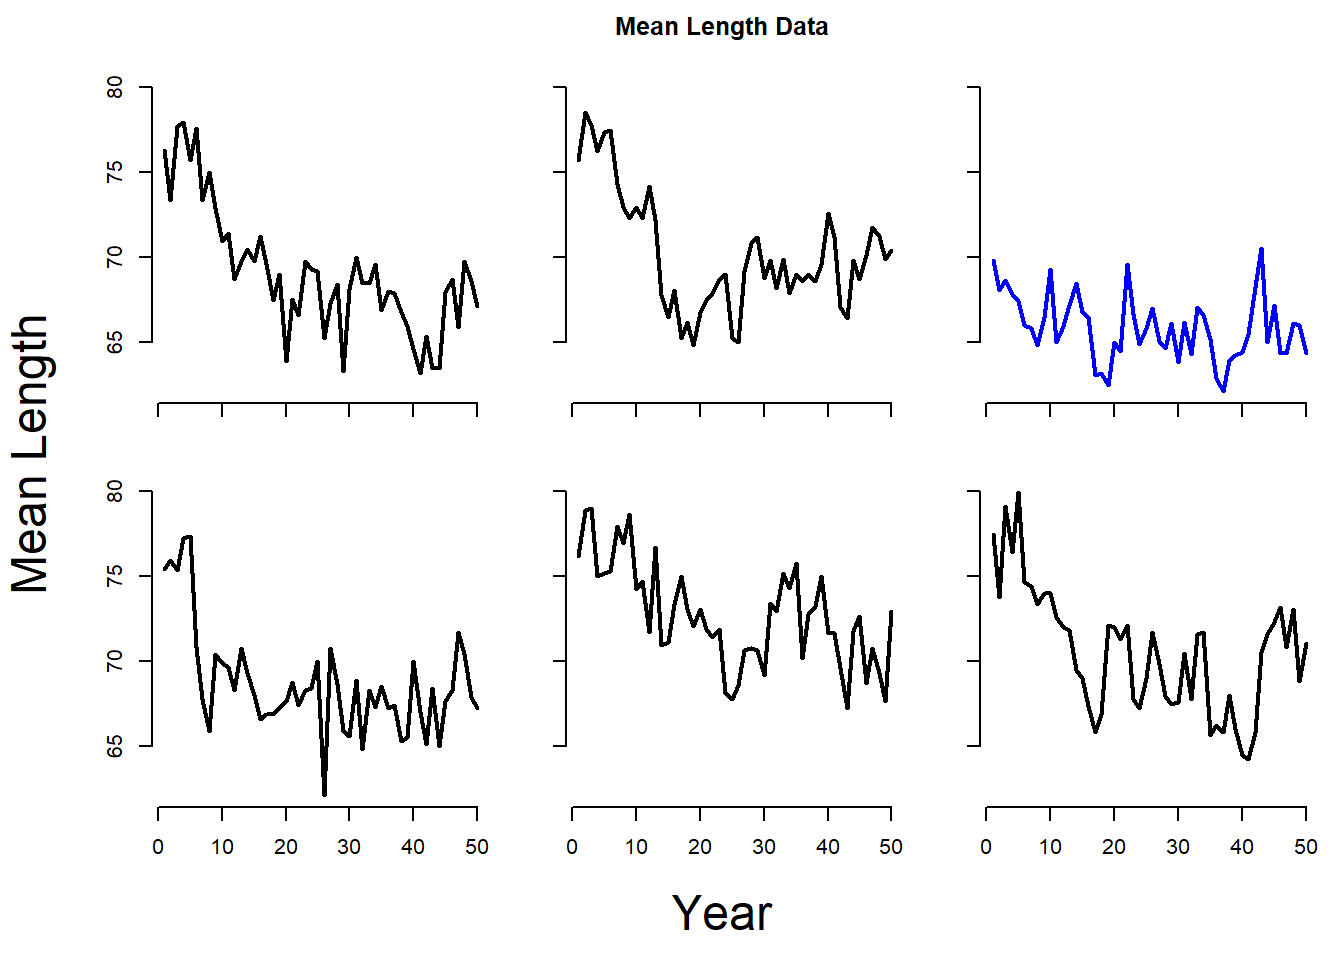
## Plotting: Catch-at-Age Data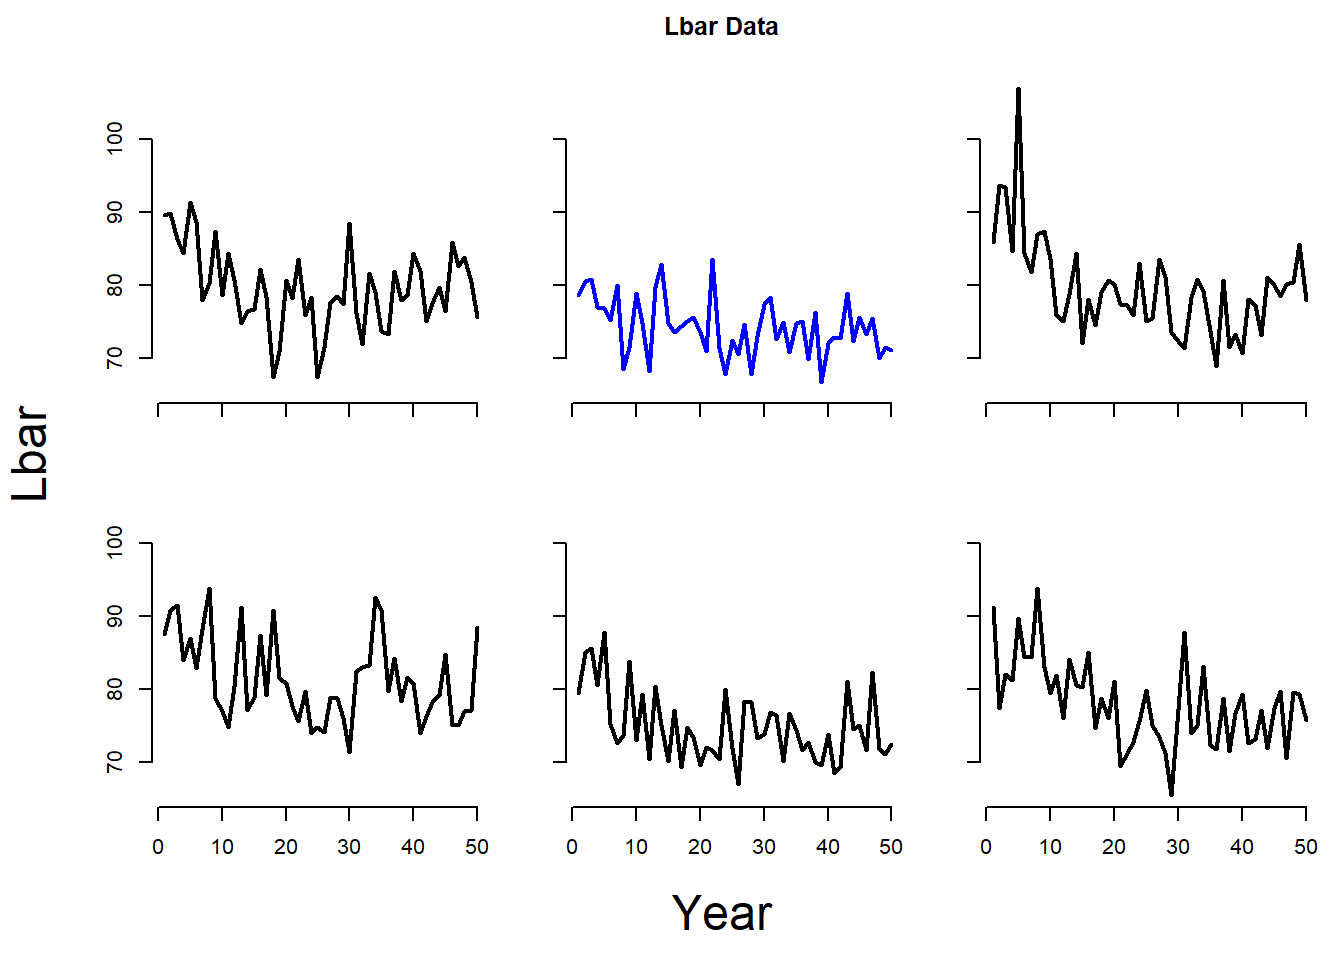
## Plotting: Catch-at-Length Data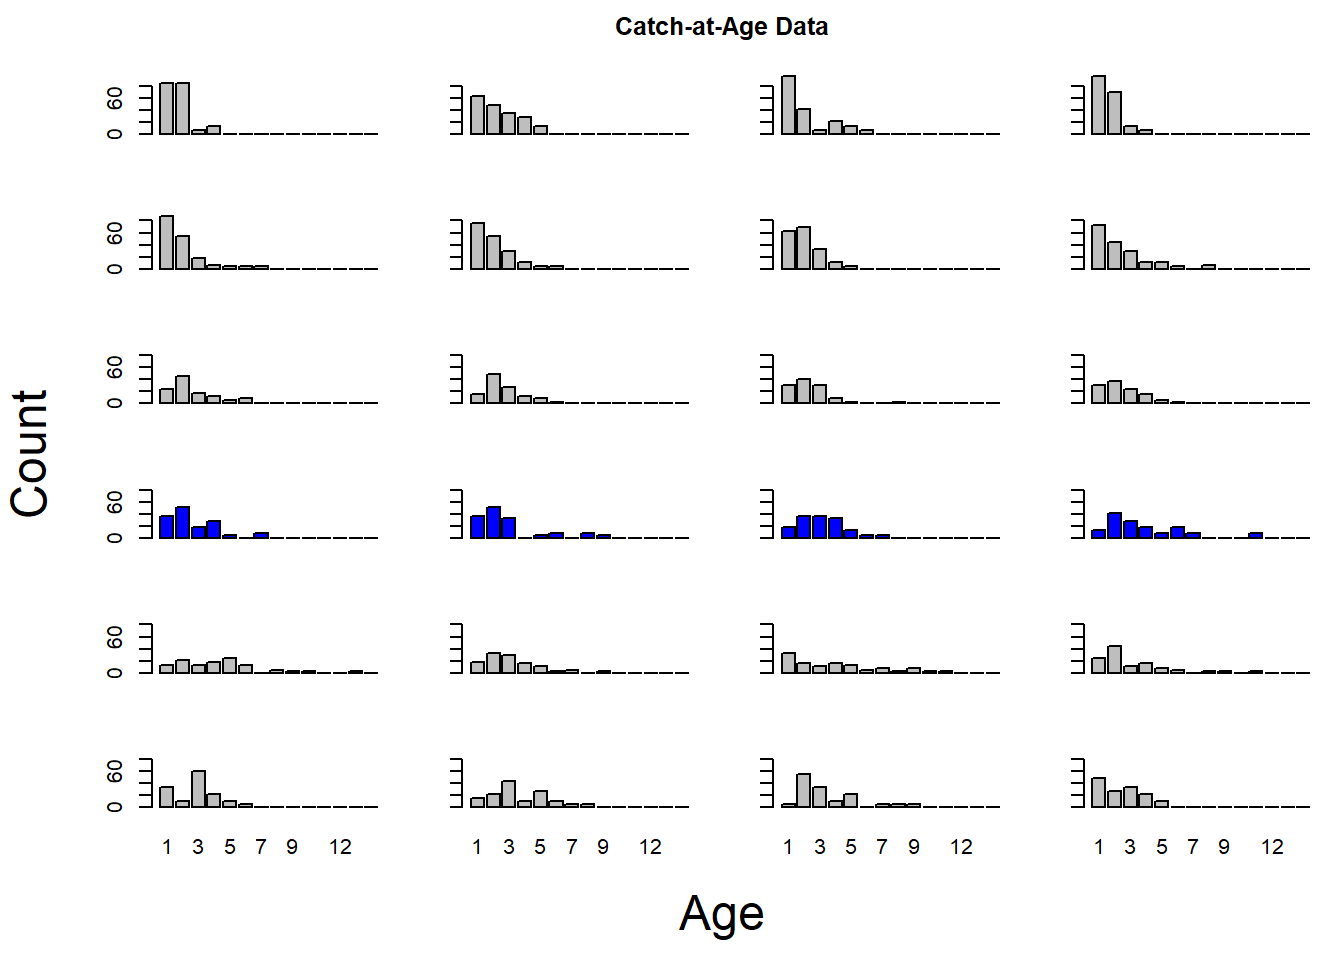
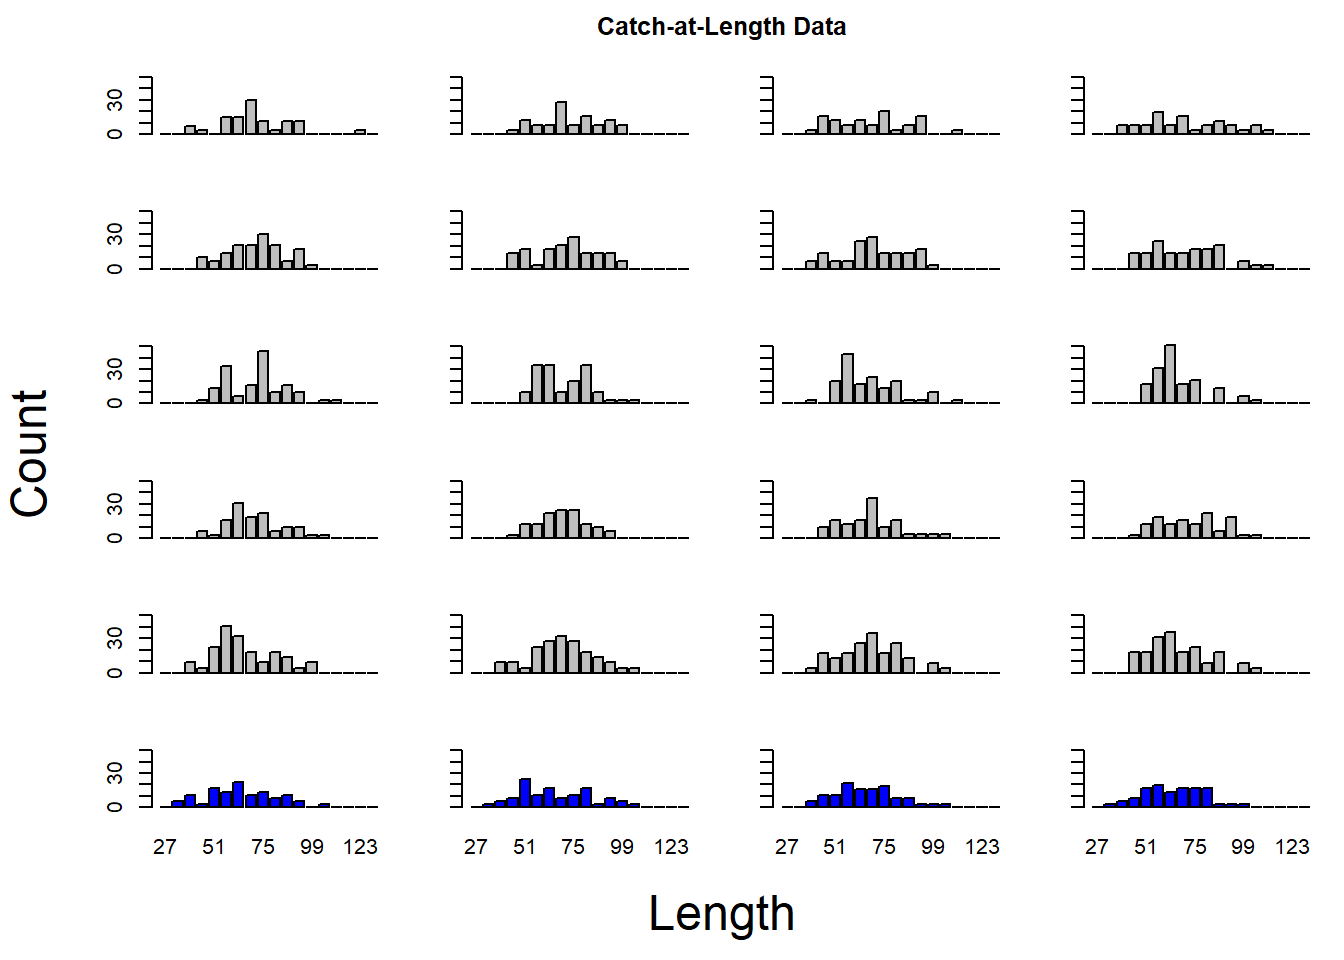
The Turing function is useful for evaluating if your OM adequately produces fishery data that appears similiar (e.g as variable) as your real observed data.